top of page

Trading
Master crypto trading with ChainDaily. Learn spot, futures, and options trading, apply technical analysis, and use effective risk management for better results.


What Is a Sideways Market? Investment Strategies for Sideways Conditions
A sideways market (also called range-bound or flat market) refers to a period when asset prices move within a tight range—neither...


What Is Copy Trading? Top Copy Trade Platforms in Crypto
What Is Copy Trading? Copy trading is a trading method where users automatically replicate the trades of professional or experienced...


What is a Trendline? How to Draw and Use Trendlines in Trading
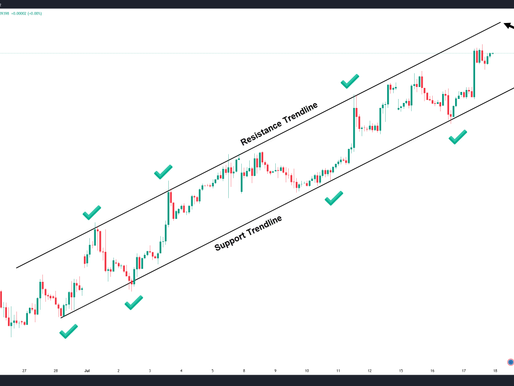
In technical analysis, trading with the trend is one of the most effective ways to reduce risk. But how do you identify the direction of...


What Is the Stochastic Oscillator? A Beginner’s Guide to Trading with Stochastic
What Is the Stochastic Oscillator? The Stochastic Oscillator is a momentum indicator that compares a specific closing price of an asset...


What Is Support and Resistance? How to Apply S&R Effectively in Crypto Trading
What Is Support and Resistance? ✅ Support Support is a price zone where buying pressure outweighs selling pressure , preventing price...


What Is Elliott Wave Theory? Trading Strategies Using Elliott Waves in Crypto
Introduction The Elliott Wave Theory is a method of technical analysis used to analyze market cycles and predict price trends based on...


What Are Bollinger Bands? How to Use Bollinger Bands Effectively in Crypto Trading
What Are Bollinger Bands? Bollinger Bands consist of three lines : Middle Band → Simple Moving Average (SMA 20) Upper Band → SMA20 + 2...


What Is RSI? How to Use the RSI Indicator Effectively in Crypto Trading
RSI (Relative Strength Index) is a momentum indicator that measures the speed and magnitude of price movements . It ranges from 0 to 100...


What Is the MACD Indicator? How to Use MACD Effectively in Crypto Trading
The MACD is a lagging momentum indicator that helps traders identify trend direction and strength. MACD consists of three components:...


What Is Ichimoku Cloud? A Complete Beginner's Guide to the All-in-One Indicator
Ichimoku Cloud , or Ichimoku Kinko Hyo , is a technical indicator that gives a comprehensive view of price action at a glance. In...


What Is Dow Theory? A Beginner’s Guide to Its Principles in Crypto Trading
If you're just getting started with technical analysis in crypto, Dow Theory is the foundation you must understand. Developed over a...


What Is Technical Analysis? How to Learn It for Crypto Trading
Technical Analysis is the process of forecasting future price movements by analyzing historical price data and market behavior. While no...


Moving Averages (MA & EMA): How to Use Them for Effective Crypto Trading
Moving averages (MA) are one of the most widely used tools in technical analysis. Whether you're day trading or investing long-term,...


What Is Leverage in Crypto? A Beginner's Guide to Trading With Leverage
Leverage in crypto trading is a powerful tool that allows traders to control a larger position with a smaller amount of capital. For...


Crypto Trading Dictionary for Beginners
Understanding the fast-paced world of cryptocurrency trading requires familiarity with a wide range of terms. This crypto trading...


What Are Japanese Candlestick Patterns? A Beginner’s Guide to Reading Candlestick Charts
Japanese Candlestick Patterns are a technical analysis tool used to visualize price movements of an asset within a specific trading...
bottom of page