What Is RSI? How to Use the RSI Indicator Effectively in Crypto Trading
- rachelbeautybar

- Aug 5
- 3 min read
RSI (Relative Strength Index) is a momentum indicator that measures the speed and magnitude of price movements. It ranges from 0 to 100 and helps identify when a crypto asset is:
Overbought → Potential price reversal to the downside
Oversold → Potential price reversal to the upside

✅ Default RSI setting is 14 periods (can be adjusted for sensitivity)
RSI Formula:
RSI = 100 - 100 / (1 + RS)
Where: RS = Average of up closes / Average of down closes
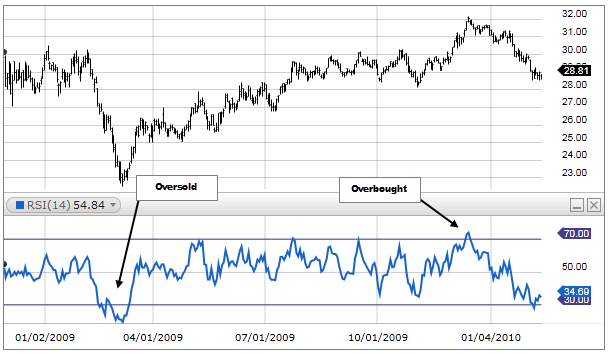
How to Read RSI Levels
RSI > 70 → Overbought (potential reversal or pullback)
RSI < 30 → Oversold (potential rebound or trend reversal)
📊 Some traders adjust RSI thresholds:
For more conservative signals: Use 80/20
For short-term scalping: Use 60/40
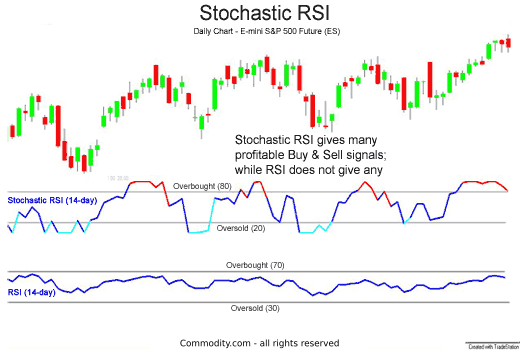
Stochastic RSI (StochRSI) – Bonus Insight
StochRSI is the RSI of the RSI—a second derivative that measures RSI’s momentum.
Formula:
Stoch RSI = (RSI - Lowest RSI) / (Highest RSI - Lowest RSI)→ Then multiplied by 100 (to normalize between 0 and 100)
⚠️ StochRSI reacts faster but can give more false signals. It's great for scalping or spotting early entries.
How to Add RSI to Your Chart
Open your crypto chart (e.g., TradingView)
Click Indicators
Search “RSI” or “StochRSI”
Adjust the period (default is 14) as needed
Change overbought/oversold thresholds if desired
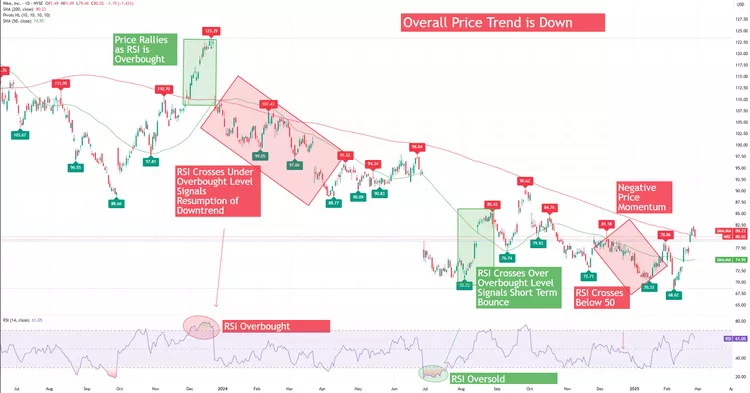
Key RSI Trading Signals
1. Overbought Conditions
RSI above 70 signals price may be overbought
Possible trend exhaustion or short-term correction ahead
Consider taking profits or setting tighter stop-losses
Example: Check for RSI > 70 + resistance zone = consider for sell
2. Oversold Conditions
RSI below 30 suggests market is oversold
Potential for reversal or bounce
Can be used to spot accumulation zones
📉 Tip: Check for RSI < 30 + support zone = better entry.

3. Divergence Signals
Divergence occurs when price and RSI move in opposite directions.
✅ Regular Bullish Divergence
Price makes lower low
RSI makes higher low→ Suggests weakening selling pressure → Potential reversal upward
❌ Regular Bearish Divergence
Price makes higher high
RSI makes lower high→ Suggests weakening momentum → Potential reversal downward
🔒 Hidden Divergence (Trend Continuation)
Hidden Bullish: Price makes higher low, RSI makes lower low → Uptrend continuation
Hidden Bearish: Price makes lower high, RSI makes higher high → Downtrend continuation
🧠 Combine divergence with support/resistance or MACD for confirmation.
RSI Trading Strategies
1. Trend Confirmation Using RSI Zones
RSI > 60 and rising → Confirm uptrend
RSI < 40 and falling → Confirm downtrend
RSI between 40–60 → Sideways / consolidation
📈 Entry in the direction of the trend gives higher probability setups.
2. Entry Based on Overbought/Oversold
Buy Setup:
RSI dips below 30, then climbs back above 30
Combine with price action support zone
Sell Setup:
RSI climbs above 70, then drops below 70
Combine with resistance level
⚠️ Don’t buy/sell just because RSI hits 30/70. Wait for confirmation.
3. Multi-Timeframe RSI Strategy
Use higher timeframe (D1) to define trend
Trade lower timeframe (H4) signals in the same direction
Example:
D1 RSI > 50 → look for Buy entries on H4 RSI dips below 30
D1 RSI < 50 → look for Sell entries on H4 RSI spikes above 70
🔁 Helps filter out noise and avoid false signals.
Common Mistakes When Using RSI
❌ Mistake 1: Blindly Acting on RSI 70/30
RSI > 70 doesn't mean price must fall
During bull runs, RSI can stay >70 for weeks
Fix: Combine RSI with volume, candlestick patterns, or moving averages
❌ Mistake 2: Ignoring Market Context
In a strong uptrend, RSI staying high is normal
Waiting for RSI to drop may cause missed opportunities
For long-term investors: Buying at RSI 70 in an uptrend may still be more profitable than waiting for a perfect entry
❌ Mistake 3: Not Using Divergence
Most traders don’t spot divergence early enough
RSI divergence often precedes trend reversals
Solution: Regularly mark RSI highs/lows and compare with price swings
Conclusion
The RSI Indicator is a versatile and beginner-friendly tool in crypto trading. It helps you:
Identify overbought or oversold zones
Confirm market trends
Spot potential reversals using divergence
Time entries and exits with greater confidence
However, RSI alone is not enough. Combine it with MACD, MA, or price action to build a more robust trading strategy.
Whether you’re swing trading or holding spot, understanding RSI can dramatically improve your decision-making and reduce emotional trading.
👉 Register via the links below to get up to 70% fee cashback:


Comments